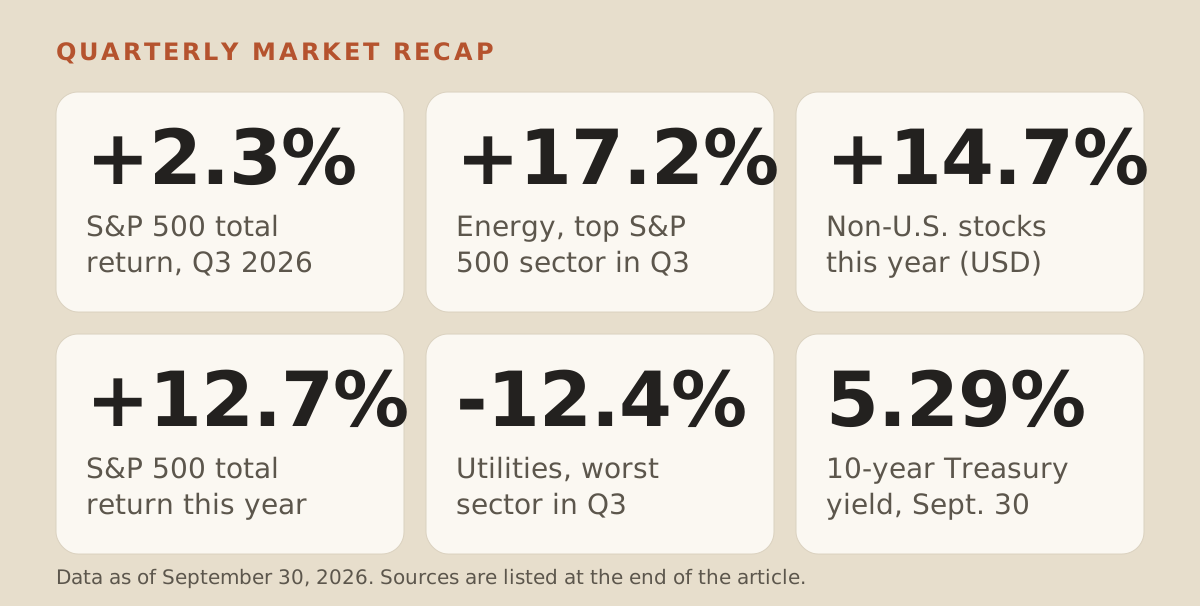
U.S. stocks gained 2.3% in the third quarter, while individual sectors swung much further. Energy stocks jumped 17.2% and utilities fell 12.4%. Bond yields sit well above where they started the year, which has hurt bond prices in 2026 but raised the income new bonds pay.
Quarterly figures for the S&P 500 and its sectors cover July 1 to September 30. All other returns cover January 1 to September 30, 2026.
U.S. stocks
The S&P 500 rose 2.3% in the quarter and is up 12.7% for the year. That's the fifth-best start to a midterm election year in data going back to 1926.
The summer was bumpier than the quarter's total suggests. Chip stocks sold off from late June into late July, amid heavy use of leverage and doubts about the payoff from AI spending. Technology still finished the quarter up 7.2%.
Energy led all sectors with a 17.2% gain. Oil ended September at about $90 a barrel on continuous NYMEX WTI futures, and disruptions in the Strait of Hormuz remain a risk to energy prices. Health care added 6.5%. Utilities (down 12.4%) and industrials (down 9.7%) were the weakest sectors.
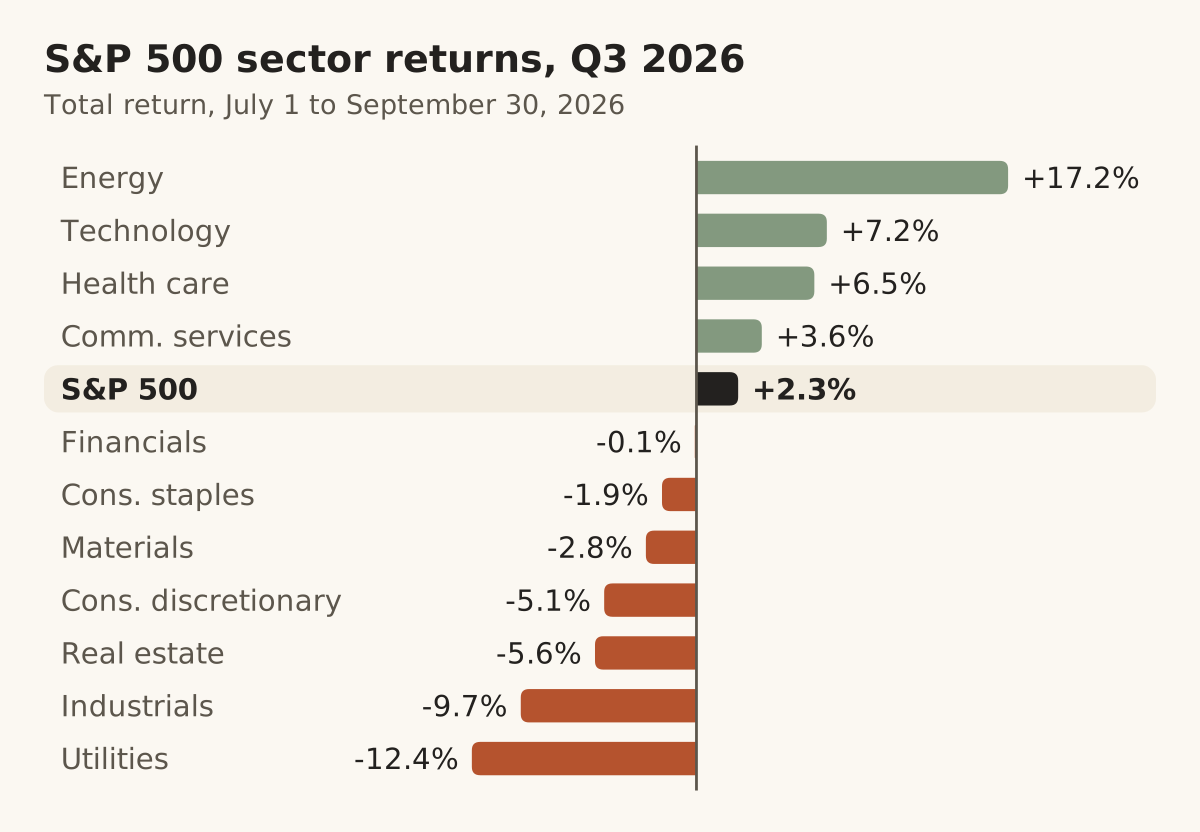
Total return, July 1 to September 30, 2026. Sectors are S&P 500 GICS sectors. Source: J.P. Morgan Asset Management, Guide to the Markets U.S., 4Q 2026.
Earnings gave the market support. As of August 7, with 88% of S&P 500 companies reporting, 8 of 11 sectors showed double-digit second-quarter earnings growth from a year earlier. That count blends actual results with estimates for companies yet to report.
Value vs. growth
Value stocks trade at lower prices relative to their earnings than growth stocks do, and this year value has come out well ahead. Large-cap value is up about 19%, against about 6% for large-cap growth. Among small companies, value is up about 17% and growth about 11%.
Keeping perspective
The S&P 500's deepest drop this year was about 9% from peak to trough. From 1980 to 2025 the index finished 35 of 46 calendar years higher. Valuations are above average, though. The index trades at 19.0 times expected earnings, against a 30-year average of 17.2.
Across asset classes
Most major asset classes are up for the year. Commodities lead with a 32.9% gain through September, and emerging-market stocks are up 23.7%. Bonds have lagged. Global high-yield bonds are flat (down 0.1%) and U.S. investment-grade bonds are down 2.9%. Cash has earned 2.8%.
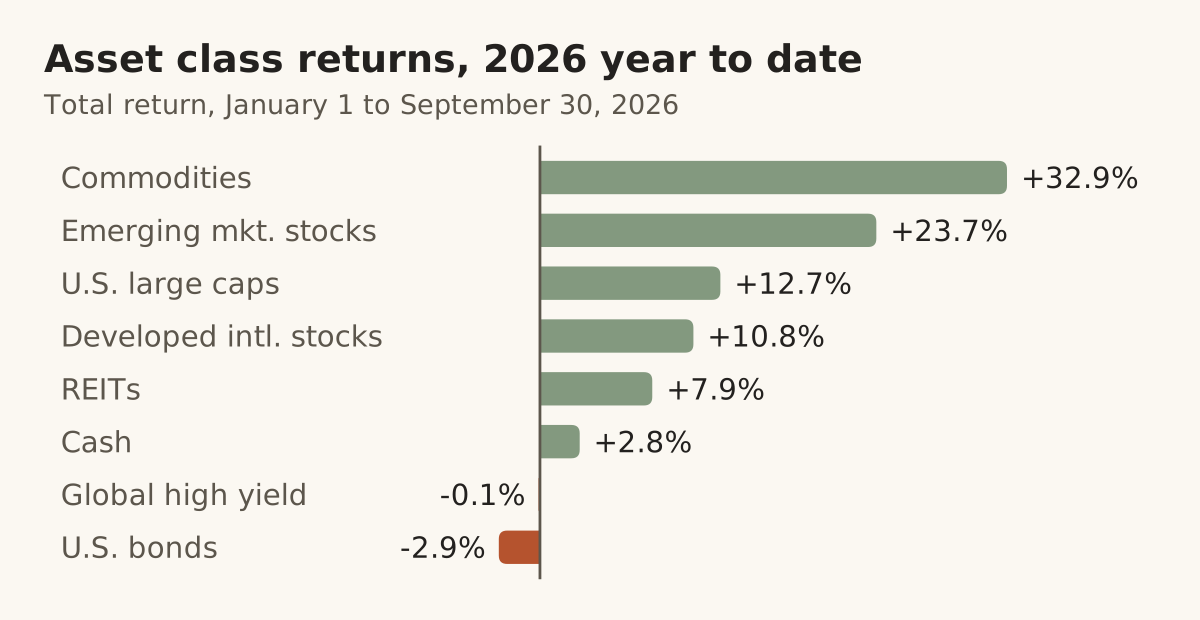
Total return, January 1 to September 30, 2026. The index for each asset class is listed in the index notes below. Source: J.P. Morgan Asset Management.
International stocks
Stocks outside the U.S. returned 14.7% in dollars this year, ahead of the S&P 500's 12.7%. Among the ten country markets in our source data, South Korea (up 98.3%) and Taiwan (up 70.7%), both central to the chips behind AI, posted the biggest gains. Japan rose 23.0%. India fell 14.7%, and China also declined.
A firmer dollar trimmed developed-market returns for U.S. investors. The MSCI EAFE index gained 12.9% in local currencies but 10.8% in dollars.
Bonds and interest rates
Treasury yields rose at every maturity shown this year. The 10-year yield ended September at 5.29%, up from 4.18% at the end of 2025. In September the Fed raised its target range by a quarter point, to 3.75% to 4.00%, its first hike in years.
For a similar rise in yields, bonds with longer duration generally lose more value. The 30-year Treasury lost 8.06% this year while the 2-year gained 0.30%.
Higher yields also mean more income for new buyers. The broad U.S. investment-grade bond market now yields 5.56%, up from 4.32% at the start of the year.
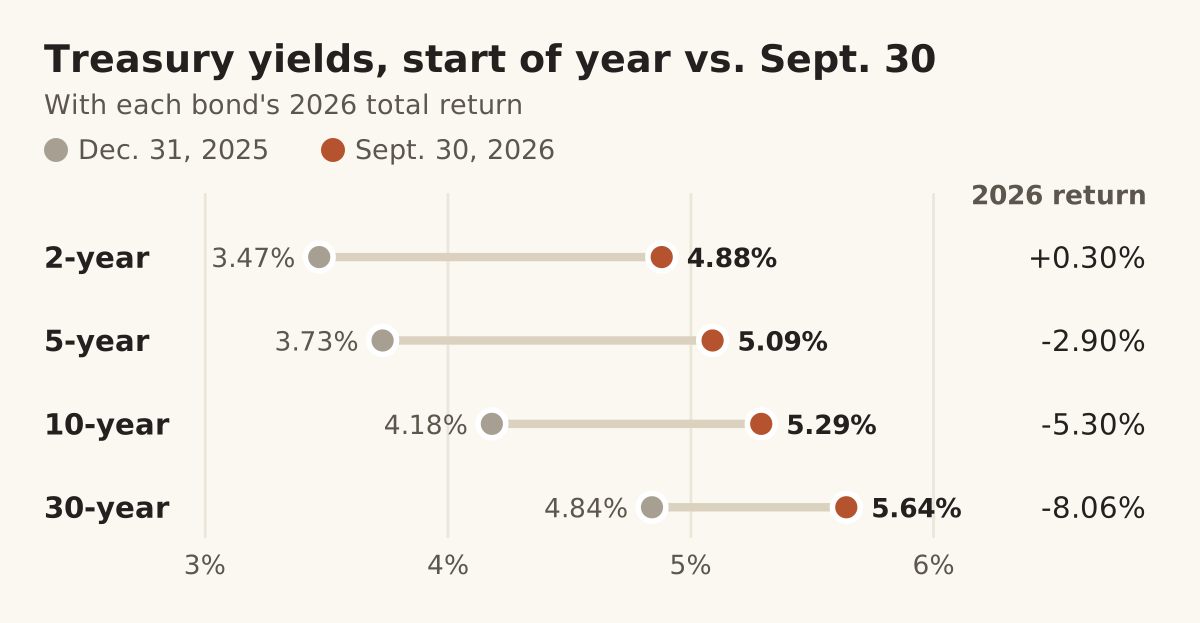
Treasury par yields and 2026 total returns. Sources: U.S. Treasury par yields. Returns from J.P. Morgan Asset Management, using Bloomberg bellwether data.
Have a question for a CFP® Professional?
Schedule a complimentary 60-minute intro. Our pricing is a flat annual fee - this fee calculator shows how that compares with an AUM% fee.
Book an intro callDisclosures: The information provided is for educational and informational purposes only and does not constitute investment, tax, or legal advice and should not be relied on as such. It is not a solicitation to buy or an offer to sell any security. It does not take into account any individual's particular investment objectives, financial situation, or needs. You should consult your own financial advisor, tax advisor, or attorney before acting on any information herein. All investing involves risk, including the possible loss of principal. Figures and tax limits referenced are for the applicable tax year and are subject to change. Valence Wealth, LLC is a registered investment advisor in the State of Arizona. Registration does not imply any specific level of skill or training.
Index notes: Returns are total returns in U.S. dollars unless noted. Indexes are unmanaged, do not reflect fees or expenses, and cannot be invested in directly. Past performance does not guarantee future results. Charts show past index returns and are not a signal to buy or sell anything. U.S. large caps: S&P 500. Sectors: S&P 500 GICS sectors. Value and growth: Russell 1000 and Russell 2000 Value and Growth indexes, rounded to the nearest whole percent because published figures differ slightly by source. Developed international stocks: MSCI EAFE. Emerging-market stocks: MSCI Emerging Markets. Stocks outside the U.S.: MSCI AC World ex USA. Countries: MSCI country indexes. MSCI returns are gross total returns, with dividends reinvested before withholding taxes. REITs: NAREIT Equity REIT. Commodities: Bloomberg Commodity. Global high yield: Bloomberg Global High Yield. U.S. investment-grade bonds: Bloomberg U.S. Aggregate. Cash: Bloomberg 1-3 Month Treasury. Treasury yields are par yields, and Treasury returns use bellwether securities. Oil is the continuous NYMEX WTI futures price, not the spot price. The midterm ranking uses the S&P 500 total return index from March 4, 1957 and the IA SBBI U.S. Large Stock total return index before that. The 2026 drop is year to date through September 30, and the 35-of-46 count covers calendar years 1980 to 2025, both on S&P 500 price returns. Valuation is the S&P 500 forward price-to-earnings ratio. Data are believed reliable but are not guaranteed.
Sources
- Guide to the Markets U.S., 4Q 2026, data as of September 30, 2026 (Bloomberg, FactSet, Federal Reserve, FTSE Russell, MSCI, NAREIT, Standard & Poor's)J.P. Morgan Asset Management
- Student of the Market, October 2026 (Morningstar data as of September 30, 2026)BlackRock
- Fall 2026 Investment DirectionsBlackRock
- Investment Directions web page, including the article "First Fed rate hike in years," September 18, 2026BlackRock
- FOMC statement, September 16, 2026Federal Reserve
- Daily Treasury par yield curve rates, 2026U.S. Department of the Treasury
- Daily Treasury par yield curve rates, 2025U.S. Department of the Treasury
- S&P 500 earnings season update, August 7, 2026FactSet
- September 2026 review and outlook (Russell value and growth returns)Nasdaq